RAPINOLOGYRapin + Technology
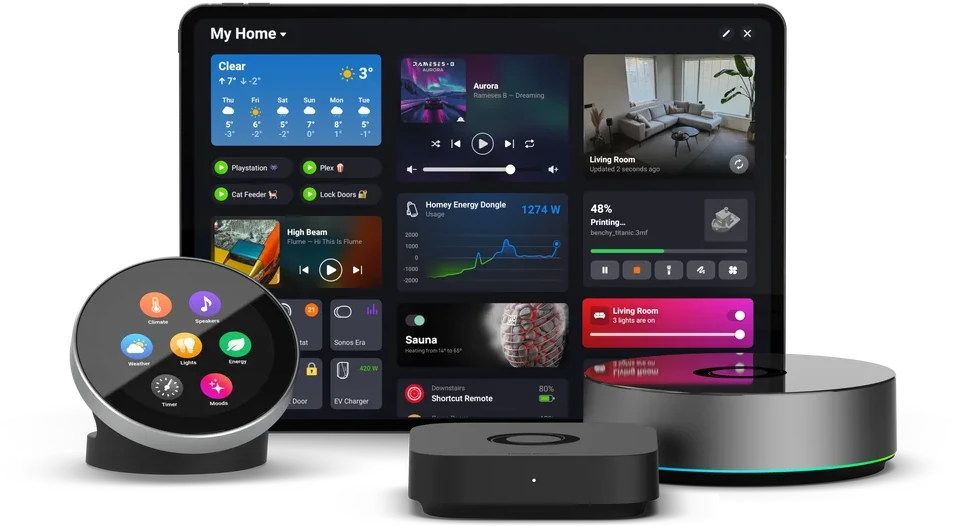
The Homey Pro hub, seen from the front, its light ring lit

Home automation · Homey Pro

Apps for Homey

A home automation hub knows what time you get up. It has no idea what diesel costs two miles away, whether a charging point is free tonight, or whether tomorrow is a red day.

These apps close that gap. The data exists, it is public, often free, and nobody brings it into the house. Each app reads it, files it into readings the hub displays, and above all turns it into Flow cards, the blocks you write an automation with, without writing a line of code.

None of them asks you to create an account. All are translated into six languages, Flow cards included. Those that read French data are limited to France, because that is the extent of the datasets they use, and they say so.

00

The catalogue

Nine apps, from the price of a tank to flood vigilance.

Homey writes an automation in three parts: when something happens, and if a condition holds, then do this. Anything on a lighter background, such as radius, is a parameter you set in the Flow. Every condition also exists in its negative form, which Homey flips with one click.

01

Available · v1.1.7

FR Carburants

Fill up at the best price, without thinking about it.

French filling stations declare their own prices, several times a day. The app follows either the best station within a radius you choose, or one specific station whose price history reads as a curve. Above all it subtracts the fuel burnt on the detour and ranks stations on the net gain: eight miles often wipe out three cents a litre.

View on the Homey App Store →

Devices

Tracked station 9 readings

  • Cheapest price
  • Price change
  • Cost of a full tank
  • Good time to refuel
  • Price level over 30 days
  • Cheapest station
  • Address
  • Distance
  • Price updated

Cheapest fuel station 13 readings

  • Cheapest price
  • Price change
  • Net saving per tank
  • Cost of a full tank
  • Good time to refuel
  • Price level over 30 days
  • Cheapest station
  • Address
  • Distance
  • Average price in radius
  • Stations found
  • Stations out of stock
  • Price updated

On the home screen

A widget is a tile placed on the Homey app's home screen: it shows without your having to open anything.

Cheapest fuel 200 px tall

The cheapest price in the radius, the station charging it, its address, the distance and the time of the reading.

Flow cards

When 7

  • it became a good time to refuel
  • A new cheapest station was found
  • The cheapest price went below threshold €/L
  • The cheapest price changed
  • The cheapest price dropped by at least threshold €/L
  • The cheapest price rose by at least threshold €/L
  • More than threshold % of stations are out of stock

And 6

  • The cheapest station is within distance km
  • it is a good time to refuel
  • The cheapest price is below threshold €/L
  • The cheapest price is at least margin €/L below the local average
  • The saving on a tank is above amount
  • station is the cheapest station

Then 3

  • Find the cheapest fuel within radius km
  • Refresh prices
  • Set the search radius to radius km
02

Available · v1.1.3

FR Bornes VE

Know a charging point is free before you leave.

Operators declare their charging points to the French national access point for transport data. The app follows every point within a radius, or one specific station, with the number of free points, the power and the tariff where it is published. It is candid about its limits: availability comes from the operators and is not always fresh, so the app always shows when the reading was taken.

View on the Homey App Store →

Devices

Tracked charging station 13 readings

  • Status
  • Free charge points
  • Charge points
  • Charge point free
  • Out of service
  • Station
  • Address
  • Distance
  • Maximum power
  • Tariff
  • Price per kWh
  • Live data coverage
  • Reading taken

Charge points nearby 13 readings

  • Free charge points
  • Charge points
  • Stations in range
  • Search radius
  • Charge point free
  • Station
  • Address
  • Distance
  • Maximum power
  • Tariff
  • Price per kWh
  • Live data coverage
  • Reading taken

On the home screen

A widget is a tile placed on the Homey app's home screen: it shows without your having to open anything.

Charge points 200 px tall

The number of free charging points, the station, its address, the tariff where published, and how fresh the reading is.

Flow cards

When 6

  • The number of free charge points changed
  • Free charge points rise above count
  • A charge point became free
  • A charge point went out of service
  • No charge point is free any more
  • The station status changed

And 5

  • At least percent% of charge points have a fresh reading
  • The station is closer than distance km
  • Free charge points are at least count
  • The published price is below price €/kWh
  • The station status is status

Then 2

  • Refresh charge point data
  • Set the search radius to radius km
03

Available · v1.1.1

FR Qualité de l'air

Let your home breathe at the right moment.

The ATMO index is published town by town, with tomorrow's forecast and the five pollutants that make it up. This is the app whose use in home automation is the most direct: ventilation that stops when the air outside is worse than the air inside, a motorised window that stays shut during a peak. The card that fires when the forecast is published leaves a whole evening to plan.

View on the Homey App Store →

Devices

Commune air quality 12 readings

  • Air quality today
  • ATMO index
  • Air quality alert
  • Main pollutant
  • Air quality tomorrow
  • NO₂ sub-index
  • O₃ sub-index
  • PM10 sub-index
  • PM2.5 sub-index
  • SO₂ sub-index
  • Index issued
  • Last update

On the home screen

A widget is a tile placed on the Homey app's home screen: it shows without your having to open anything.

ATMO index 150 px tall

The town, the numeric index placed on its colour scale, and the pollutant driving it.

Air quality 150 px tall

The same thing in words rather than figures: the town, the level spelled out and the main pollutant.

Flow cards

When 4

  • The air quality index changed
  • A pollution episode is under way
  • The air quality drops to level or worse
  • Tomorrow's forecast is published

And 3

  • the air quality is level or worse
  • the air quality is level
  • tomorrow's air quality is level

Then 1

  • refresh the air quality index
04

In review · v1.1.2

Dew Point & Mould Guard

Know when a wall is about to get wet, in degrees rather than a vague warning.

This one fetches nothing from outside. It takes a temperature and humidity sensor you already own, an outdoor temperature, and computes the room's dew point, then the temperature of its coldest wall. What it gives, and no sensor gives alone, is a margin: how many degrees still separate the wall from the moment water condenses on it. A hygrometer reading sixty-five per cent does not say whether that is serious. A margin of one degree does.

View on the Homey App Store →

Devices

Room 6 readings

  • Mould risk
  • Margin before condensation
  • Dew point
  • Cold wall temperature
  • Temperature
  • Humidity

On the home screen

A widget is a tile placed on the Homey app's home screen: it shows without your having to open anything.

Room 200 px tall

The margin before condensation in large type, the risk level, and below them the dew point and the cold wall temperature.

Flow cards

When 2

  • The dew point rises above value °C
  • The mould risk became level

And 2

  • The dew point is above value °C
  • The mould risk is level

Then 1

  • Recalculate now
05

In development · v1.2.0

Ephemerides

Every twilight, golden hour and moon phase for your home, computed offline.

Where Homey only knows sunrise and sunset, this app gives the fourteen instants of the day, the three twilights, the golden hour and the blue hour, plus the position of the sun and the moon at any moment, with phase, illumination and age. A second device adds the French public holidays, mainland or Alsace-Moselle. At high latitudes, and even in Paris in summer, some twilights do not exist: the app says so instead of inventing a time.

Devices

Ephemerides 13 readings

  • Sun phase
  • Sun altitude
  • Sun azimuth
  • Day length
  • Next solar event
  • Next solar event at
  • Moon phase
  • Moon illumination
  • Moon above horizon
  • Moon age
  • Moon altitude
  • Moon azimuth
  • Moon distance

Public holidays (France) 6 readings

  • Public holiday today
  • Today's public holiday
  • Public holiday tomorrow
  • Next public holiday
  • Next public holiday date
  • Days until the next public holiday

On the home screen

A widget is a tile placed on the Homey app's home screen: it shows without your having to open anything.

Public holidays 150 px tall

Today's public holiday, or the fact that it is an ordinary day, then the countdown to the next one and its date spelled out.

Sun and moon 200 px tall

The sun's current phase, the time of the next event in large type, the length of the day, and at the foot the moon phase with its illumination and a dot telling whether the moon is up.

The computation, step by step

These calculations rest on suncalc, a third-party library whose actual behaviour had to be checked step by step, its documentation still describing an earlier version. Three gaps between what it documents and what it returns had to be found and corrected before the app said anything true.

  1. 01

    From apparent height to geometric height

    hauteur géométrique = hauteur apparente − réfraction(max(hauteur géométrique, 0))

    suncalc returns an apparent height, atmospheric refraction included, while sunrise, sunset and the twilights are defined on the geometric height, that of the disc's true centre. But its refraction formula first clamps the height to zero, which adds a constant 0.484° everywhere below the horizon, at −18° as much as at −1°. Exposing the apparent height would have made a “below −6°” threshold fire two minutes after civil dawn, for the same definition. Below the horizon, removing the refraction is thus a plain subtraction; above it, where it varies with height, it takes iteration, and a single pass crossing the kink oscillates without converging: six are needed.

  2. 02

    Which way the sun is moving, even with no sunrise or sunset

    montant = maintenant < midi solaire

    A height of −3° is a dawn in the morning, a dusk in the evening: the sky's phase therefore depends on which way the sun is moving, not on its height alone. That direction cannot be read off sunrise, which does not exist in every season or at every latitude, but off solar noon, the only reference that stays defined even on a day of midnight sun or polar night.

  3. 03

    Three ways of saying nothing

    événement absent = null, undefined, ou Invalid Date selon le champ

    An event that does not happen that day, an astronomical dusk in the middle of a Nordic summer, say, does not always take the same absent shape: depending on the field, suncalc returns `null`, `undefined`, or an invalid date. A plain `instanceof Date` does not catch all three, and reading the time of an invalid date throws rather than signals it. All three shapes are therefore reduced to one single signal before reaching the rest of the code.

  4. 04

    The ladder of sky phases

    jour ≥ 6° > heure dorée ≥ −0,833° > crépuscule civil ≥ −6° > nautique ≥ −12° > astronomique ≥ −18° > nuit

    Ten phases follow one another between full daylight and full night, each bounded by a geometric height of the sun: daylight above 6°, golden hour down to the official sunrise at −0.833°, then the three twilights, civil, nautical and astronomical, at −6°, −12° and −18°, before night. The same ladder, read the other way, gives the morning phases. This is the ladder the tile's own capability reads, its ten labels coming from the manifest rather than being duplicated in the translations.

  5. 05

    The moon's phase and age

    phase lunaire ∈ [0, 1[, 0 = nouvelle lune, 0,5 = pleine lune ; âge = phase × 29,530588853 j

    suncalc returns the lunar phase as a fraction of the cycle between 0 and 1, where 0 is new moon and 0.5 is full moon. That single fraction is turned into one of the eight usual names, new moon, waxing crescent, first quarter…, by a plain series of boundaries. Multiplied by the mean length of a lunation, 29.530588853 days, it also gives the moon's age, with no separate calculation: the same fraction carries both pieces of information.

  6. 06

    Easter Sunday, and its cross-check

    algorithme grégorien anonyme (Meeus, Jones, Butcher), confronté à l'algorithme de Gauss de 1900 à 2200

    The eleven public holidays of the general regime all follow from a fixed date or from Easter Sunday, computed offline by the anonymous Gregorian algorithm, valid for any year of the Gregorian calendar. Rather than taking it on trust, a test checks it against Gauss's algorithm, formulated independently, across the three hundred and one years from 1900 to 2200: the two agree every single year. Alsace-Moselle adds two days to the general regime, Good Friday and 26 December, under local law.

  7. 07

    The right instant, in the right time zone

    instant local = mur UTC − décalage(fuseau), décalage recalculé deux fois après un premier essai

    Scheduling an announcement for six in the evening local time requires knowing that zone's offset at that very instant, yet the offset itself depends on the instant still being sought, because of daylight saving. The first guess starts from a wall-clock hour treated as UTC, then the real offset is recomputed at that corrected instant, twice in a row: the process converges even on a clock-change day, and a test checks it over three hundred and sixty-five days and three time zones.

Flow cards

When 8

  • event happens
  • minutes minutes from event
  • The sun goes direction degrees°
  • The moon rises
  • The moon sets
  • The moon phase becomes phase
  • Today is a public holiday
  • Tomorrow is a public holiday

And 12

  • It is daytime
  • The sun is above degrees°
  • It is the golden hour
  • It is the blue hour
  • It is between start and end
  • The moon is above the horizon
  • The moon phase is phase
  • The moon is more than percent % lit
  • Today is a public holiday
  • Tomorrow is a public holiday
  • The next public holiday is within days day(s)
  • Today is holiday

Then 1

  • Recompute now
06

In development · v1.0.2

Sensor Trends

Turn any sensor into a trend: rising, falling or steady, with the pace.

Any numeric sensor becomes a trend: rising, falling or steady, with the pace per hour and a confidence that says by how much the slope exceeds the sensor's own noise. Add a forecast at a chosen horizon and the time left before a threshold is reached. A temperature climbing two tenths an hour does not call for the same response as one climbing two degrees.

Devices

Trend 5 readings

  • Trend
  • Slope
  • Confidence
  • Forecast
  • Time to threshold

On the home screen

A widget is a tile placed on the Homey app's home screen: it shows without your having to open anything.

Trend 200 px tall

The value and its slope per hour, the confidence, a curve over the observed window, and the time to the threshold when there is one.

The computation, step by step

A trend is easy to announce and hard to stand behind: two readings are enough to draw a line, and a noisy sensor draws a new one every time. Here is what the app does so that it says “it is rising” only when it really is.

  1. 01

    The line, by Theil-Sen

    pente = médiane des (vⱼ − vᵢ) ⁄ (tⱼ − tᵢ), pour toutes les paires i < j

    The slope is not fitted by least squares but taken as the median of the slopes of every pair of points. An outlier only enters the pairs that contain it, a minority, and the median discards it. Least squares, by contrast, minimises squared deviations: one wild point then outweighs all the others together. Over three hundred points that is 44,850 pairs, a few milliseconds.

  2. 02

    The sensor's noise

    σ = 1,4826 × médiane( |rᵢ − médiane(r)| ), avec rᵢ = vᵢ − (a + b·tᵢ)

    Noise is measured on the deviations from the line, not on the raw values: a clear rise is not noise. The median absolute deviation is used, which the factor 1.4826 turns into a standard deviation. A floor guards against a trap: on a quantised sensor, an anemometer reading whole kilometres per hour for instance, more than half the deviations can be identical and the estimate fall to zero. Noise is therefore never claimed finer than half the sensor's own step.

  3. 03

    The uncertainty on the slope

    σ_pente = σ ⁄ ( √n × σ_t ) × 3600

    The noise of a reading is not the noise of the slope. The more points there are, the surer the slope, hence the square root of n; and the more they are spread over time, the surer still, hence the standard deviation of the timestamps in the denominator. Ten readings taken within a minute say far less about a trend than the same ten spread over an hour.

  4. 04

    The deadband

    zone morte = k × σ_pente, avec k = 3 par défaut

    Below three times its own uncertainty, a slope cannot be told apart from noise: the app reports “steady” rather than inventing a movement. The factor is adjustable, and it can be replaced by a fixed threshold in units per hour when you know what you are looking for.

  5. 05

    The confidence

    fiabilité = min( 100 ; 50 × |pente| ⁄ (k × σ_pente) )

    It says by how much the slope exceeds its own noise, and nothing else. Fifty means the slope is exactly the deadband, one hundred that it is twice it. A clear slope on a noisy sensor can therefore be highly reliable, and a tiny slope on a precise sensor not reliable at all.

  6. 06

    The forecast and the time to threshold

    v̂ = a + b·t_dernier · prévision = v̂ + b × horizon · échéance = (seuil − v̂) ⁄ b

    Both start from the model's value at the last instant, never from the last raw reading: extrapolating from a noisy point would carry that noise forward. The time to a threshold returns nothing in the three cases where a number would lie, namely a slope inside the deadband, a threshold already crossed or on the wrong side, and a time beyond twenty-four hours, a distance at which the slope will have changed several times.

  7. 07

    The hysteresis

    changement retenu si confirmé 2 fois de suite ET direction précédente tenue ≥ 300 s

    This is the only thing that stops a shutter from flapping around its threshold. A change of direction is accepted only after two consecutive confirmations, and only if the previous direction held for at least five minutes. Both conditions are required together.

  8. 08

    The turning point

    fenêtre coupée en deux, chaque moitié ajustée ; signes opposés et hors zone morte → pic ou creux

    A single line cannot see a peak: it averages it away. The window is therefore cut in two halves, each fitted separately, each needing at least four points. If both slopes clear the deadband and have opposite signs, the app reports a peak when the first was rising, a trough when it was falling.

Flow cards

When 5

  • The value departs from its habit by sigma standard deviations
  • The trend became direction
  • threshold will be reached within minutes min
  • kind was detected
  • The sensor seems stuck

And 4

  • The confidence is at least percent%
  • The trend is direction
  • threshold will be reached before minutes min
  • The slope is operator value per hour
07

In development · v1.0.0

FR Saint du jour

Know whose name day it is, without opening a calendar.

Nominis, the service of the Catholic Church in France, publishes the saint celebrated each day and the first names attached to it, pet forms included. You list the ones that matter to you, and a card fires on the day itself, another the evening before at an hour you choose. Three special cases are handled rather than ignored: 29 February has no principal saint and the app says so, All Saints' Day celebrates every name at once, and a pet form counts as much as the name it comes from.

Devices

Saints calendar 6 readings

  • Saint of the day
  • Name days today
  • A watched name is celebrated
  • Number of name days
  • Saint of tomorrow
  • Reading taken

On the home screen

A widget is a tile placed on the Homey app's home screen: it shows without your having to open anything.

Saint of the day 200 px tall

The saint of the day in large type with its note, the names celebrated below, and at the foot those of your watched names that are, plus tomorrow's saint. On All Saints' Day the list gives way to the fact that everyone is celebrated.

Flow cards

When 3

  • The saint of the day has changed
  • A watched name is celebrated
  • A watched name is celebrated tomorrow

And 3

  • Today is the feast of nom
  • prenom is celebrated today
  • Everyone is celebrated today

Then 1

  • Refresh the calendar
08

In development · v1.0.1

ISS

Know when the space station flies over, and when it can be seen.

The International Space Station circles the Earth in ninety-two minutes and flies over your home several times a day. The app computes those passes a day ahead, for the position of your Homey, and above all tells apart the ones you can see with the naked eye, which needs three things at once: the station lit by the Sun, your own sky already dark, and enough height to clear the rooftops. A Flow can then switch on a light or warn you a few minutes ahead.

Devices

Overhead pass 8 readings

  • Pass under way
  • Elevation above the horizon
  • Ground distance
  • Distance to the station
  • Next pass at
  • Minutes until the next pass
  • Peak elevation of the next pass
  • Next pass visible to the naked eye

On the home screen

A widget is a tile placed on the Homey app's home screen: it shows without your having to open anything.

Next pass 200 px tall

The time of the next pass in large type and how long until it, then the arc of its course drawn at its true height, higher for an overhead pass than for a grazing one. The dot and the curve turn gold when the pass can be seen with the naked eye.

The computation, step by step

Predicting a pass means knowing where the station will be, where that puts it relative to you, and whether you will be able to see it. The three questions are handled separately, and the third is the one where mistakes are easiest.

  1. 01

    Where the station will be

    le service répond aux instants futurs, jusqu'à 24 h, balayage au pas de 60 s, 30 instants par requête

    There is no orbit propagator on board, and that is deliberate. The service accepts a request for the position at a future instant, up to twenty-four hours ahead, so the window can simply be scanned minute by minute. A whole day costs forty-nine requests, against a stated quota of three hundred and fifty per five minutes. The scan runs only at startup, at midnight, and on demand.

  2. 02

    The angle between you and the point below it

    γ = 2·arcsin( √( sin²(Δφ⁄2) + cos φ₁ · cos φ₂ · sin²(Δλ⁄2) ) )

    This is the angle at the Earth's centre between your home and the point directly under the station. It uses the haversine formula rather than the direct cosine, which loses all precision when two points are close, which is exactly when the station passes overhead. A test exercises it on two points a metre apart.

  3. 03

    The elevation above the horizon

    h = arctan2( cos γ − R ⁄ (R + a) , sin γ )

    This is what the eye sees, and so the quantity that decides everything. The two-argument arctangent is used rather than a division, which would give infinity at the zenith, where the sine vanishes. The device setting acts on this height, ten degrees by default: below that, a pass is swallowed by roofs and trees.

  4. 04

    The two distances, which are not comparable

    d = √( R² + (R + a)² − 2 · R · (R + a) · cos γ )

    The distance to the station is the chord through space, given by the law of cosines. The ground distance is the arc travelled over the surface, R times the angle. When the station is far, the arc is longer than the chord, which is surprising on the tile but perfectly correct: at a hundred degrees apart there are nearly eleven thousand kilometres of ground for ten thousand as the crow flies.

  5. 05

    The check that validates the whole geometry

    rayon de visibilité = R · arccos( R ⁄ (R + a) ) ≈ 2 257 km à 420 km d'altitude

    This is the radius of the circle from which the station stands above the horizon. The service publishes a footprint of its own, the diameter of that very circle, so the two can be compared. The measured gap is 1.34 kilometres out of 2,258, six hundredths of one per cent, which matches the choice of Earth radius, mean here and equatorial there. The geometry is thus validated without having to take the service at its word.

  6. 06

    Whether the station is lit, and the trap to avoid

    la station est éclairée si γ(station, point subsolaire) < 90° + arccos( R ⁄ (R + a) )

    The service publishes a field called “visibility”, and trusting it would be a mistake. It describes the ground under the station, not the station: it answers “daylight” when it is day below, even though the station is in full sunlight and perfectly visible to a distant observer in the dark. Relying on it led to the conclusion that no pass was visible over twenty-four hours; computing the illumination from the subsolar point, which the service also supplies, brought out two passes, both in the small hours, which is indeed when the station is seen at this time of year. The Earth's shadow is treated as a cylinder, and the altitude adds some twenty degrees to the half-angle.

  7. 07

    How dark your sky is

    hauteur du Soleil chez l'observateur < −6°, le crépuscule civil

    This is the condition the service does not provide and which has to be computed here: a lit station crossing a daylit sky stays invisible. The Sun's elevation comes from the NOAA equations, the same as in the Ephemerides app, and the two implementations were compared: they agree to a ten-thousandth of a degree on a value read in operation.

  8. 08

    Cutting the series into passes

    un passage = les instants consécutifs où h > 0 ; retenu si son sommet atteint la hauteur minimale

    The scanned series is cut into runs of consecutive instants where the station stands above the horizon. Each run gives a pass, of which the start, the end, the peak and its azimuth are kept. Those whose peak falls short of the configured height are discarded, and a pass is declared visible only if one of its instants meets all three conditions at once. The distance card, for its part, fires only on a downward crossing: otherwise it would fire again at every reading for as long as the station stayed inside the radius.

Flow cards

When 4

  • A pass begins
  • A pass begins shortly
  • A visible pass begins shortly
  • The station comes within distance km

And 3

  • The station is above degrees °
  • A pass is under way
  • The next pass is visible to the naked eye

Then 1

  • Recompute the passes
09

In development · v1.0.0

FR Vigilance

Flood and wildfire danger levels near you, from French public services.

Two French public services, watched side by side. Vigicrues colours every river section green, yellow, orange or red; the Météo des forêts publishes each day, by département, tomorrow's and the day after's wildfire danger, during the fire season. The app follows a section found by name or suggested near your Homey, and a département found by name or number, and can react the moment a level rises.

Devices

Flood vigilance 3 readings

  • Vigilance level
  • Vigilance alert
  • Last update

Wildfire danger 4 readings

  • Vigilance level
  • Level the day after tomorrow
  • Vigilance alert
  • Last update

On the home screen

A widget is a tile placed on the Homey app's home screen: it shows without your having to open anything.

Flood vigilance 200 px tall

A coloured dot, from green to red, with the name of the followed section and how old the reading is.

Wildfire danger 200 px tall

Two dots side by side, tomorrow and the day after, for the followed département. Empty outside the fire season, from June to September.

The computation, step by step

Vigicrues offers neither a search by coordinates nor by name: the national feed gives every section at once, leaving it to the app to sort them. The Météo des forêts, for its part, only publishes a feed that grows every day, with a département's latest value buried inside it.

  1. 01

    The nearest section

    distance ≈ haversine(centroïde du tronçon, position de la Homey)

    Each section is a line, sometimes tens of kilometres long: its position is reduced to the average of every point in its geometry, a centroid, good enough to sort more than three hundred sections by proximity without computing a true distance to the nearest segment. The same list serves pairing, to suggest sections near the Homey, and the search by name.

  2. 02

    One reading for every section followed

    un relevé national partagé par tous les appareils, plutôt qu'un par appareil

    The national feed weighs about two megabytes, whatever the number of sections being looked up in it. Fetching it once per followed device would have multiplied that weight for no reason: it is therefore cached for the length of a cycle and shared across every device of the driver, each of which only picks out its own section.

  3. 03

    The seasonal gap, told apart from a failure

    hors juin-septembre : le fichier de l'année est absent, pas en panne

    The Météo des forêts is only published during the fire season, from June to September: outside that window, the year's file simply does not exist yet, or any more. The device says so plainly, without mistaking it for a network failure, which is still flagged as such.

Flow cards

When 1

  • the vigilance level changes

And 1

  • the level is at least niveau

Then 1

  • refresh the level
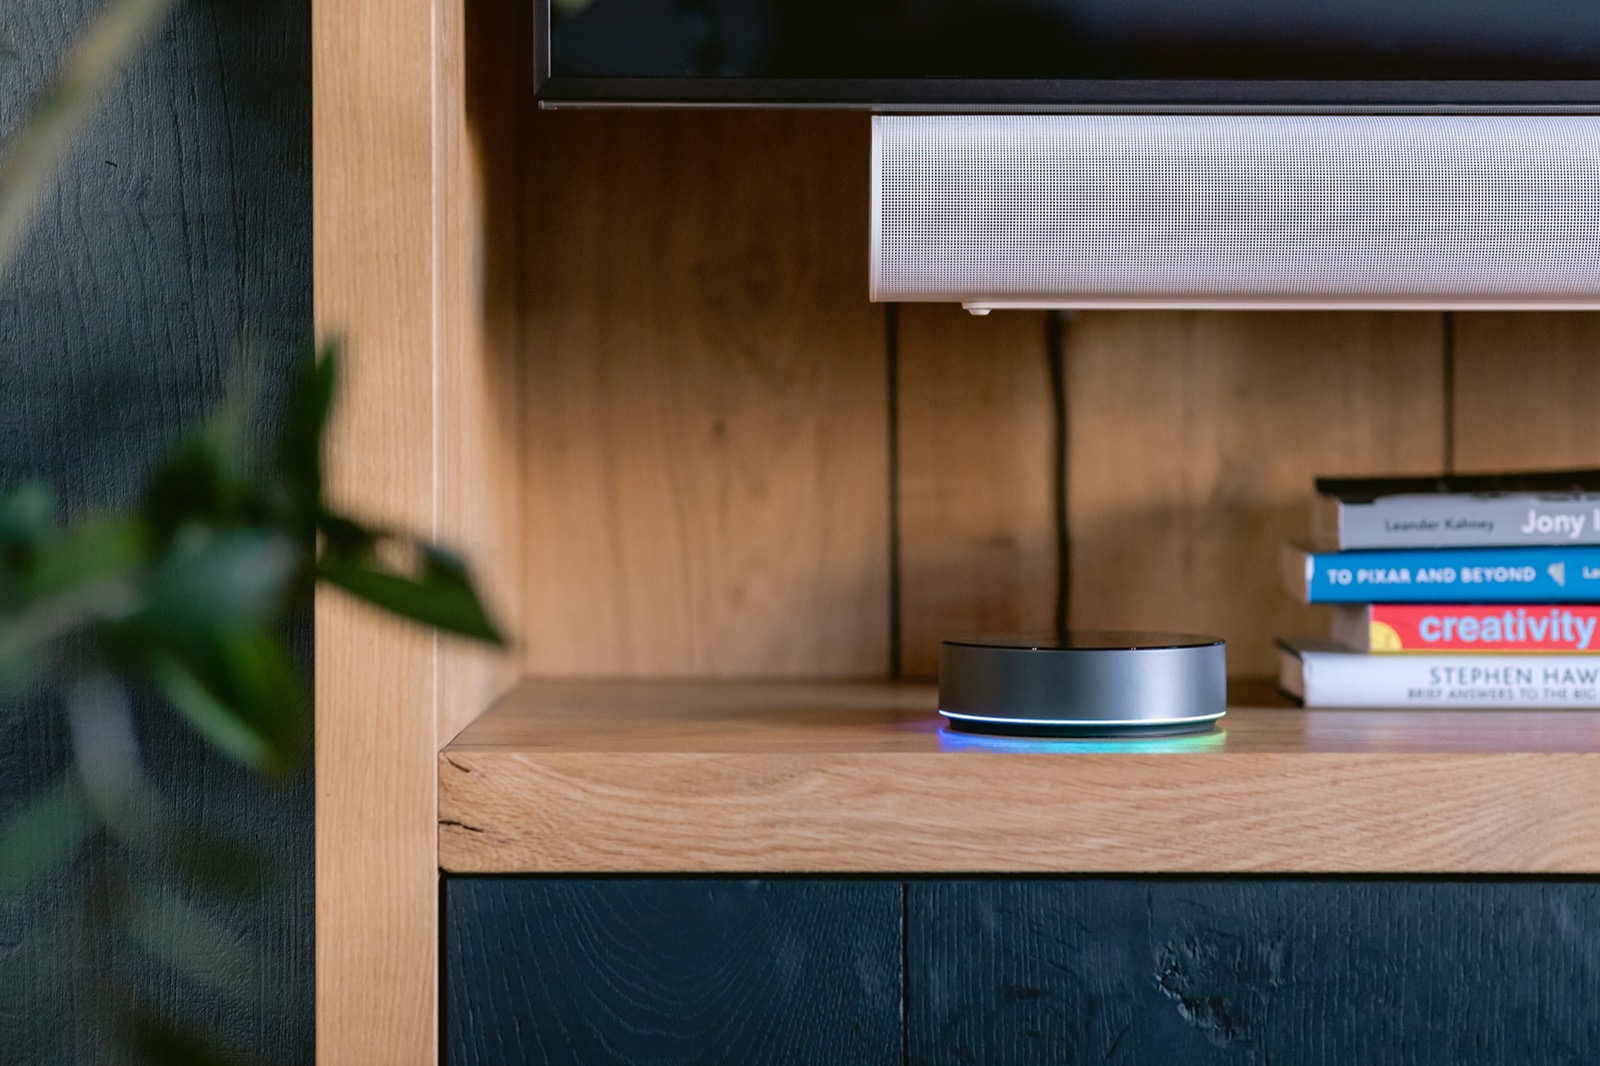
A Homey Pro sitting on a living room shelf, below a television
The hub fits in one hand and sits anywhere. Everything these apps compute is computed there, in your home.
08

What they have in common

What they have in common

They are written with Homey's official development kit, without needless dependencies, and each one runs on a real Homey Pro before it is published. The data they read is public and free; those that compute do so on the hub, without any information leaving your home.